Changelog

Follow new updates and improvements to T-Stats Solutions.

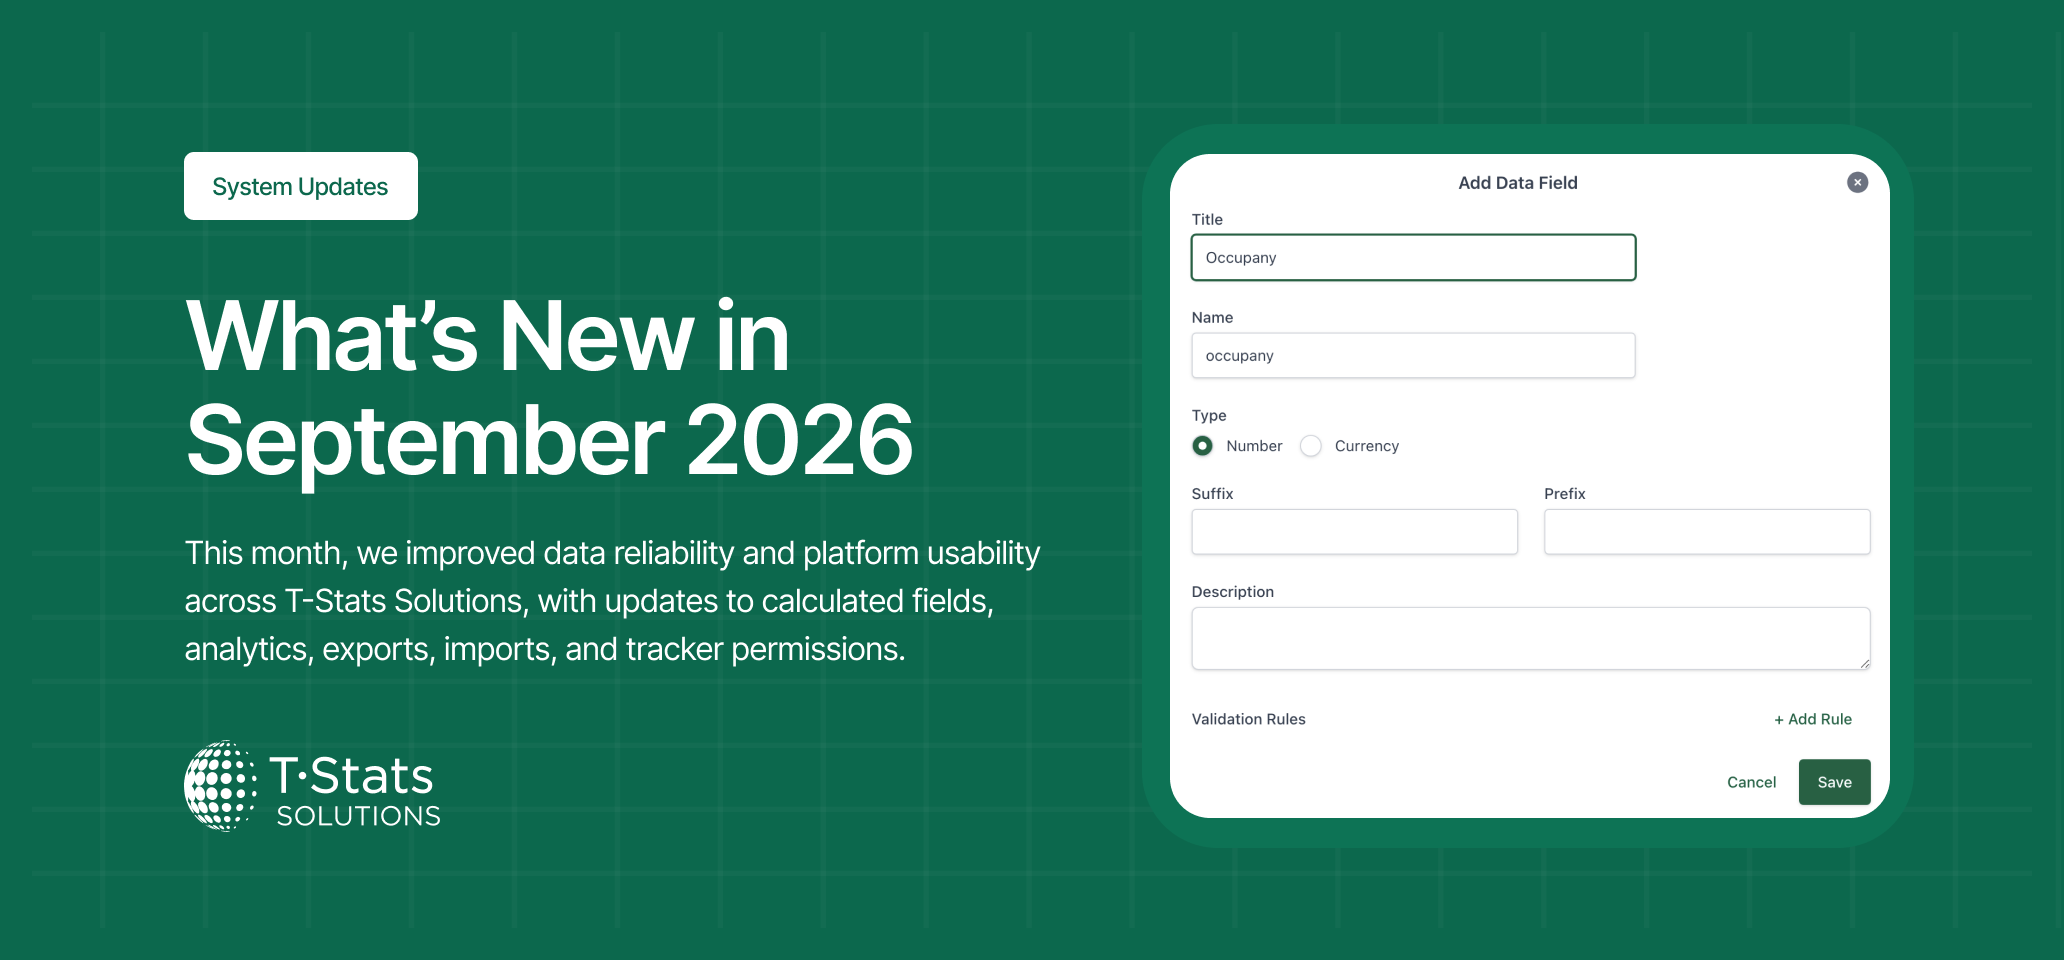
September 9th, 2026

We've made several updates this month to enhance the power and usability of T-Stats Solutions. These include fixes for issues affecting exports, imports, and core analytics functionality, along with data improvements.

ENHANCEMENTS

Calculated Field Names Can No Longer Match Existing Data Field Names

  • What is the change: A validation rule has been introduced to prevent calculated fields from being given the same name as an existing data field in the tracker. The system now rejects the naming conflict at the point of configuration.

  • What is the impact: Prevents calculation errors caused by the system being unable to resolve which field to reference when a calculated field shares a name with a data field. Removes a known source of data inaccuracy at the root.

BUG FIXES

Data Export Now Working Correctly Across All Systems

  • What is the change: Fixed an issue where the data export feature was not functioning, preventing users from downloading exported data files.

  • What is the impact: Users can once again export data and download reports without interruption.

National Tracker Data Import No Longer Fails on All Rows

  • What is the change: Fixed a critical import failure where every row in an import file was being rejected when importing data into a national tracker. The same file imported correctly into a tenant-owned tracker, confirming the issue was specific to the national tracker import path.

  • What is the impact: Data can now be imported into national trackers correctly, with rows processed and stored as expected.

Manage Trackers Permission Now Correctly Grants Access to Tracker Settings

  • What is the change: Fixed an issue on the system where users assigned a newly created role with the Manage Trackers permission could not access Tracker Settings, despite the same permission working correctly for another existing role on the same system.

  • What is the impact: Users assigned the new role can now correctly access Tracker Settings and Data Reporting, enabling them to carry out their administrative responsibilities.

Thanks for using T-Stats! We're committed to making the platform better for you and your businesses every month. Your feedback helps shape these improvements, so please keep in touch!
Write a comment...

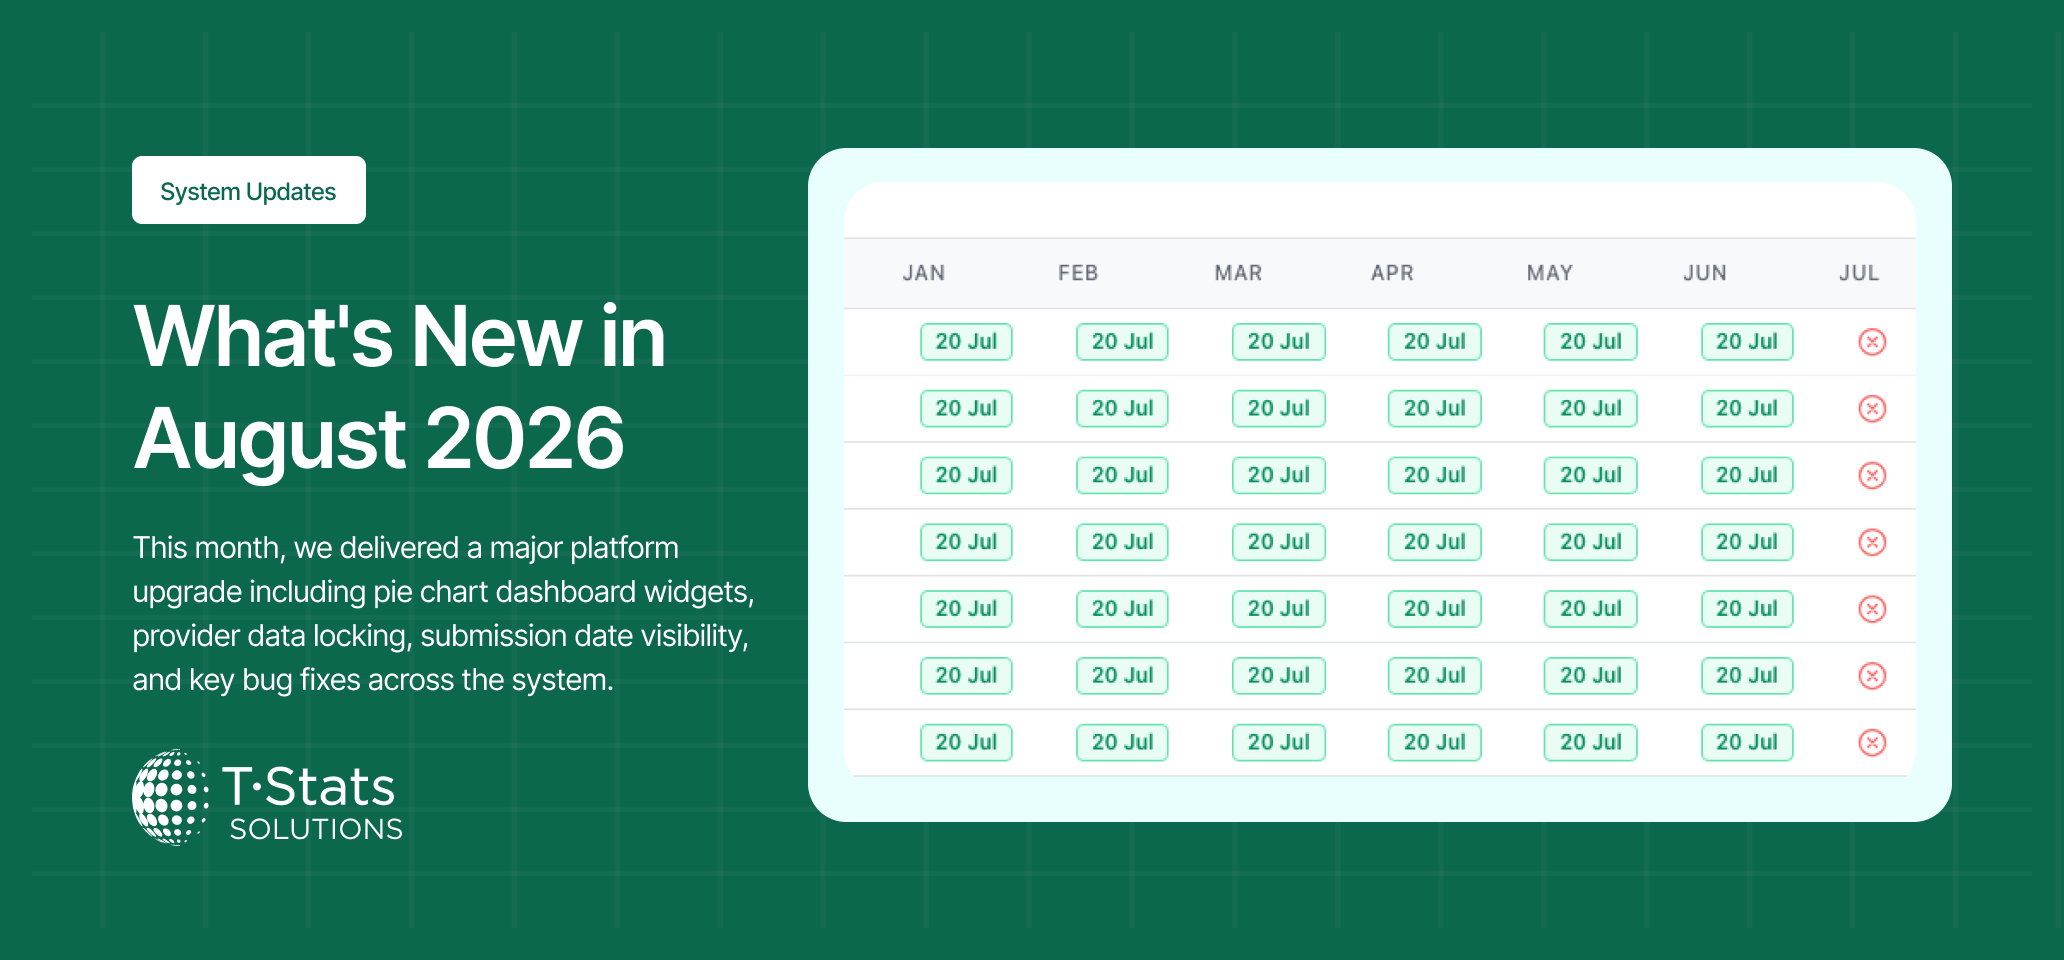
August 5th, 2026

We've made several updates this month to enhance the power and usability of T-Stats Solutions. These include a major platform upgrade along with data and chart fixes:

FEATUES

Pie Chart Now Available as a Dashboard Widget

  • What is the change: Pie chart visualisations can now be added as widgets on the dashboard, alongside the existing chart widget types.

  • What is the impact: Users can render pie chart data directly on their dashboard without navigating to the tracker analysis view, enabling richer and more personalised dashboard configurations.

Data Submission Date Now Visible in the Admin View

  • What is the change: The date on which provider partners submit their data is now displayed in the Data Reporting area, making submission timing visible to administrators for the first time.

  • What is the impact: Administrators can now see at a glance when each provider submitted their data, supporting compliance monitoring and the identification of late submissions.

Accommodation Providers Automatically Locked After Data is Published

  • What is the change: Accommodation providers’ data submissions can now be automatically locked out of editing their submitted data once it has been published. Administrators retain the ability to unlock and edit data. A configurable message is displayed to providers explaining how to request a change.

  • What is the impact: For those destinations that require it, prevents providers from modifying data after it has been published, protecting the integrity of the published dataset and reducing the risk of post-publication edits going unnoticed.

ENHANCEMENTS

Dashboard Text Widget Now Supports Paragraph Alignment and Full-Width Rendering

  • What is the change: The dashboard text widget now correctly applies paragraph position settings and renders text across the full width of the widget when set to full-width layout.

  • What is the impact: Admins can now produce properly formatted text widgets on the dashboard, including centred, left-aligned, and full-width text layouts, without the content bunching to the left.

Removing an Import Now Automatically Removes Associated Providers

  • What is the change: When an import is removed, any providers that were created as part of that import are now automatically deleted alongside the import data. Previously, providers created by an import had to be deleted manually one by one.

  • What is the impact: Cleaning up incorrect or unwanted imports is now significantly faster, particularly for trackers with many providers.

BUGS

Mandatory Provider Onboarding Fields Can No Longer Be Bypassed

  • What is the change: Fixed an issue where newly invited accommodation providers could bypass mandatory Provider Onboarding fields without completing them.

  • What is the impact: Providers are now required to complete all mandatory onboarding fields before proceeding, ensuring the system captures the required data from every new provider from the outset.

Thanks for using T-Stats! We're committed to making the platform better for you and your businesses every month. Your feedback helps shape these improvements, so please keep in touch!
Write a comment...

July 13th, 2026

We've made several updates this month to enhance the power and usability of T-Stats Solutions. These include fixes to the polygon drawing function and enhancements to granularity reporting. Here's what's new:

ENHANCEMENTS

"All Metrics On By Default" Now Configurable Per Tracker

  • What is the change: The "All Metrics On By Default" setting can now be toggled on the individual tracker overview page

  • What is the impact: Admins can now control metric display on a per-tracker basis, configuring which metrics are enabled by default in the analysis view.

Quarterly Granularity Now Available for Tracker Analysis

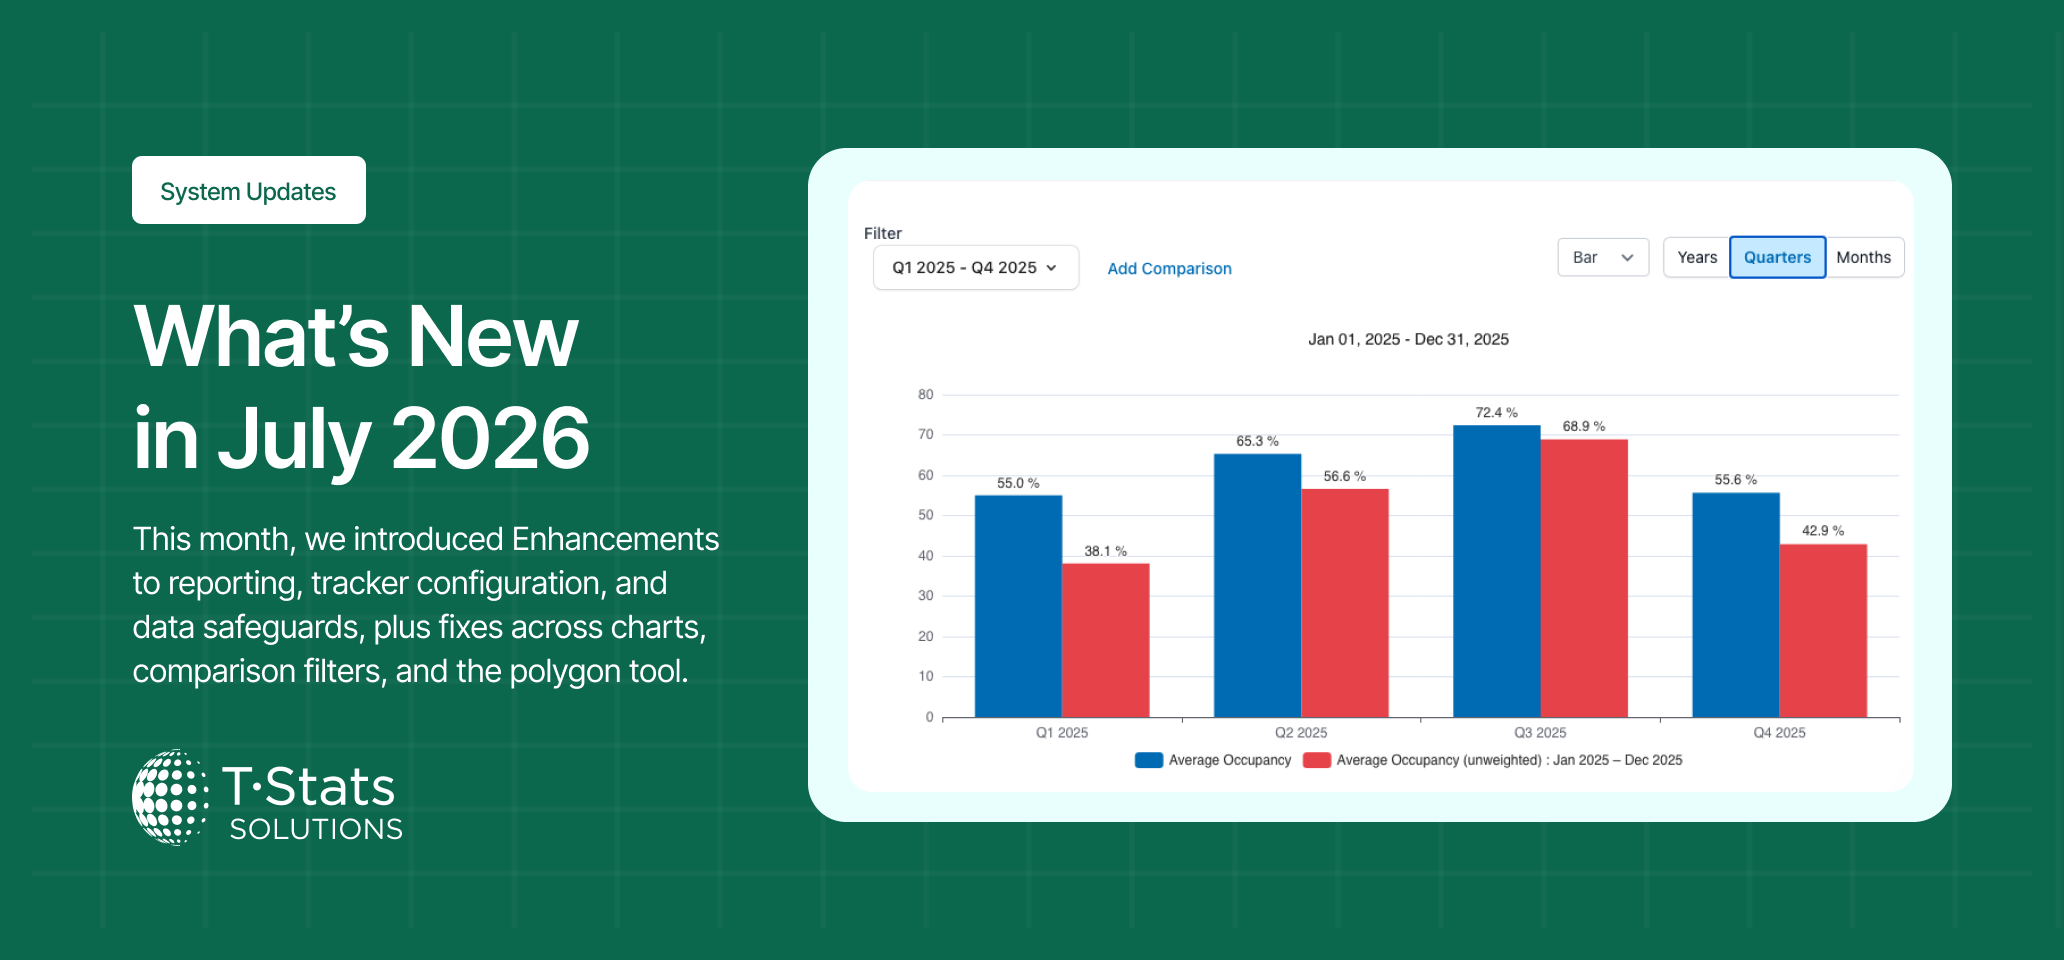
  • What is the change: A quarterly granularity option has been added to tracker analysis views, allowing users to view and compare data at a quarter-by-quarter level.

  • What is the impact: Users can now perform quarter-based analysis, align tracker insights with quarterly planning cycles, and compare seasonal performance across standardised reporting periods.

Clear Tracker Data Now Requires Confirmation Before Executing

  • What is the change: The Clear Tracker Data action now displays a confirmation prompt before executing, consistent with the safeguard already in place for the Delete Tracker action.

  • What is the impact: Admins are protected from accidental data loss caused by inadvertently triggering the clear action. The prompt gives users the opportunity to cancel before any data is removed.

BUG FIXES

Pie Chart Add Comparison No Longer Merges Periods into One Slice

  • What is the change: Fixed an issue where adding a pie chart via the Add Comparison feature merged both data periods into a single combined pie chart instead of displaying them separately.

  • What is the impact: The Add Comparison feature now correctly handles pie charts, presenting each period distinctly rather than combining them into misleading output.

Reminder Emails No Longer Sent to Providers Who Have Already Submitted

  • What is the change: Fixed an issue where reminder emails were being sent to providers who had already submitted data for the relevant period.

  • What is the impact: Providers who have submitted data on time no longer receive incorrect reminders, avoiding unnecessary confusion and maintaining trust in platform communications.

Polygon Drawing Tool Restored Across All Browsers

  • What is the change: Fixed an issue where the polygon drawing tool was not functioning in Chrome or Safari. The cursor was not changing to a pen nib when Draw Polygon was selected, and existing polygons were not rendering in the Settings view.

  • What is the impact: Admins can once again draw, view, and manage geographic polygons across all supported browsers.

Thanks for using T-Stats! We're committed to making the platform better for you and your businesses every month. Your feedback helps shape these improvements — keep it coming!

Write a comment...

June 8th, 2026

We've made several updates this month to enhance the power and usability of T-Stats Solutions. These updates brought focus on chart refinements and improved data integrity. Here's what's new:'

ENHANCEMENTS

Import Validation Now Enforces Single Provider Constraints

  • What is the change: Improvement of the import process to validate that import files comply with single-provider tracker configurations.

  • What is the impact: Prevents incorrect data from being imported into single-provider trackers, improving data integrity and reducing the risk of inflated sample sizes in the analysis view.

Chart Bars Now Display in the Same Order as Tracker Metrics

  • What is the change: Updated tracker chart rendering so that bar order consistently reflects the order of metrics as defined in the Tracker Metrics configuration in Settings.

  • What is the impact: Charts are now consistent with tracker configuration, making it easier to match chart output to the configured metric order.

Pie Chart Slices Now Show Percentage Labels Only

  • What is the change: Removed raw data value labels from pie chart slices, leaving only the percentage (%) label displayed on each slice

  • What is the impact: Reduces visual clutter on pie charts and makes percentage data easier to read at a glance.

BUG FIXES

Pie Chart Now Displays the Active Filter as the Chart Title

  • What is the change: Fixed an issue where the pie chart title did not update when a provider filter was applied.

  • What is the impact: Users can now clearly identify which filter is active when viewing a filtered pie chart.

Pie Chart Now Shows a "No Data" Message When No Data Is Available

  • What is the change: Fixed an issue where the pie chart continued to render even when no data was available for the selected filter or period.

  • What is the impact: Users are now clearly informed when no data is available, preventing misinterpretation of an empty chart.

Chart Legend Now Correctly Assigns Distinct Colours to Each Dataset

  • What is the change: Fixed an issue where the chart legend was not correctly mapping colours to search criteria, causing multiple datasets to appear in the same colour.

  • What is the impact: Each dataset is now rendered in a distinct colour with the legend correctly identifying each one, restoring the ability to meaningfully compare datasets.

Thanks for using T-Stats! We're committed to making the platform better for you and your businesses every month. Your feedback helps shape these improvements — keep it coming!

Write a comment...

May 6th, 2026

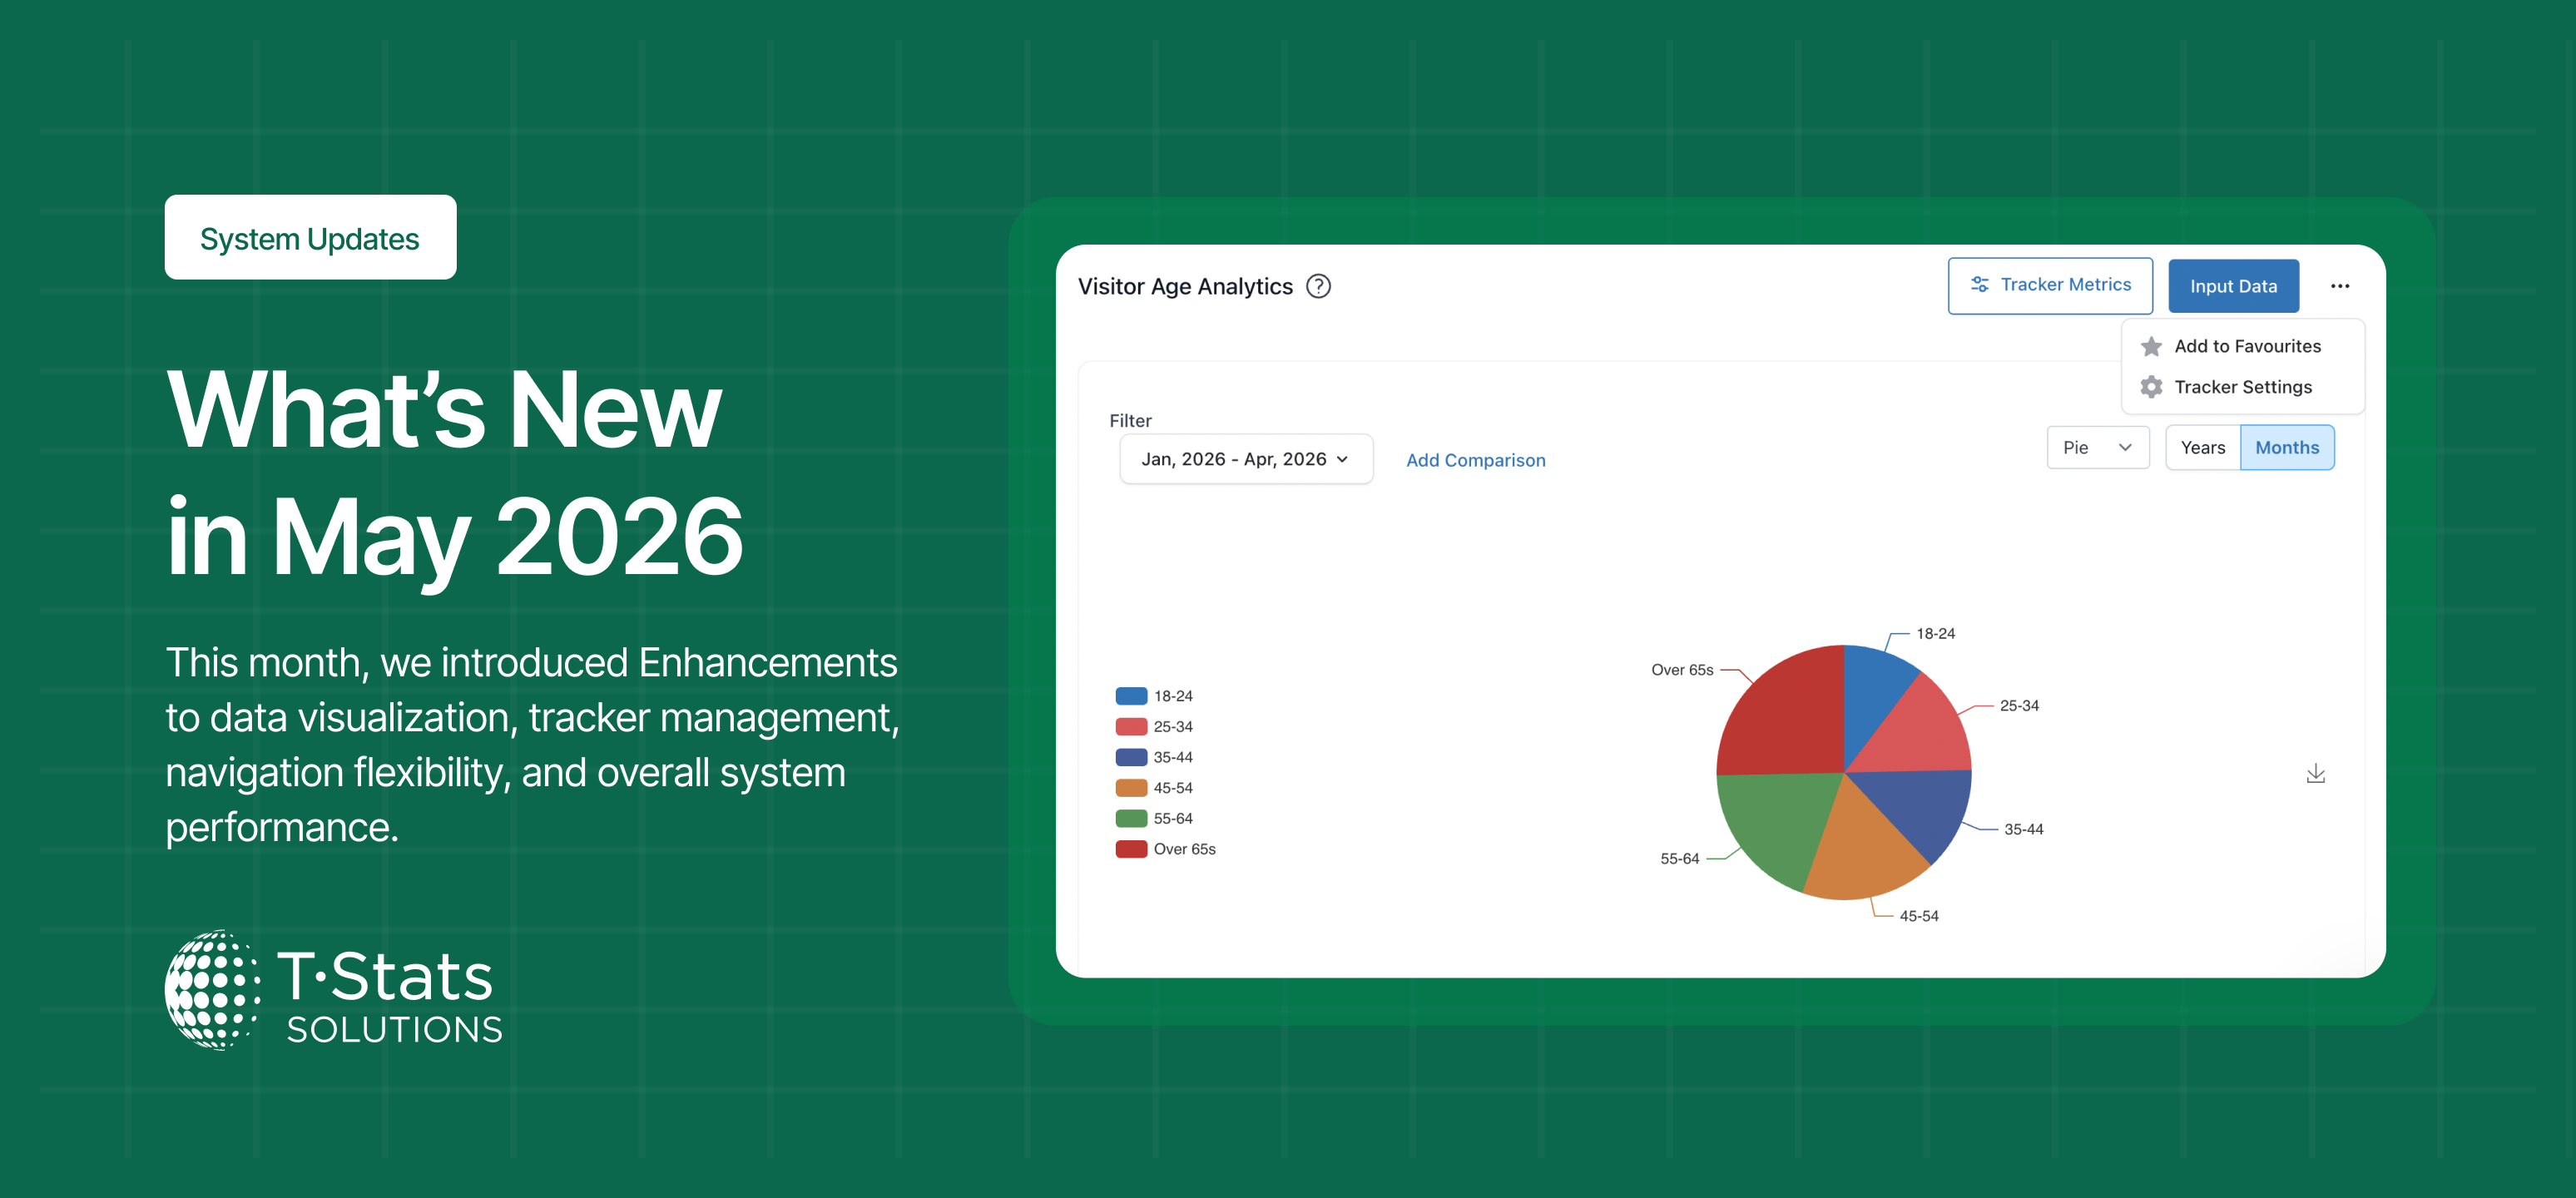
We've made several updates this month to enhance the power and usability of T-Stats Solutions. From pie chart visualisations for trackers to tracker archiving and favourites, here's what's new:

ENHANCEMENTS

Added Pie Chart Visualisation to Trackers

  • What is the change: Introduced a pie chart option for tracker metrics, available in both the back-end and analysis views.

  • What is the impact: Users can now visualise tracker data as a pie chart for appropriate data-sets, enabling richer and more varied data presentation.

Archive Trackers Without Losing Data

  • What is the change: Added an Archive option for trackers, allowing users to deactivate a tracker without permanently deleting it or its data.

  • What is the impact: Users can now archive inactive trackers to keep their workspace clean while preserving historical data for future reference or reactivation.

Save Favourite Trackers for Quick Access

  • What is the change: Added the ability to save trackers as favourites, surfacing them in a dedicated favourites section on the tracker list sidebar.

  • What is the impact: Users can now access their most-used trackers instantly without searching through the full tracker list each time.

Assign Trackers to Multiple Navigation Groups

  • What is the change: Updated the tracker back-end to allow a tracker to be assigned to more than one navigation menu group.

  • What is the impact: Admins can now organise trackers across multiple menu groups, improving navigation flexibility for different user contexts.

Toggle Data Point Figures on Charts

  • What is the change: Added a toggle control to show or hide numeric figures displayed on chart data points.

  • What is the impact: Users can now customise chart views by hiding figures for cleaner presentations or showing them for detailed analysis.

BUG FIXES

Imported Data Not Showing on Input Screen

  • What is the change: Fixed an issue where data imported into the system was not displaying on the Input Data screen.

  • What is the impact: Imported data now appears correctly on the Input Data screen after a successful import.

Notification Box Not Rendering for Some Users

  • What is the change: Fixed an issue where the notification box did not render correctly for users without My Business Settings access.

  • What is the impact: The notification box now displays correctly for all users regardless of their permission level.

Thanks for using T-Stats! We're committed to making the platform better for you and your businesses every month. Your feedback helps shape these improvements — keep it coming!

Write a comment...

April 3rd, 2026

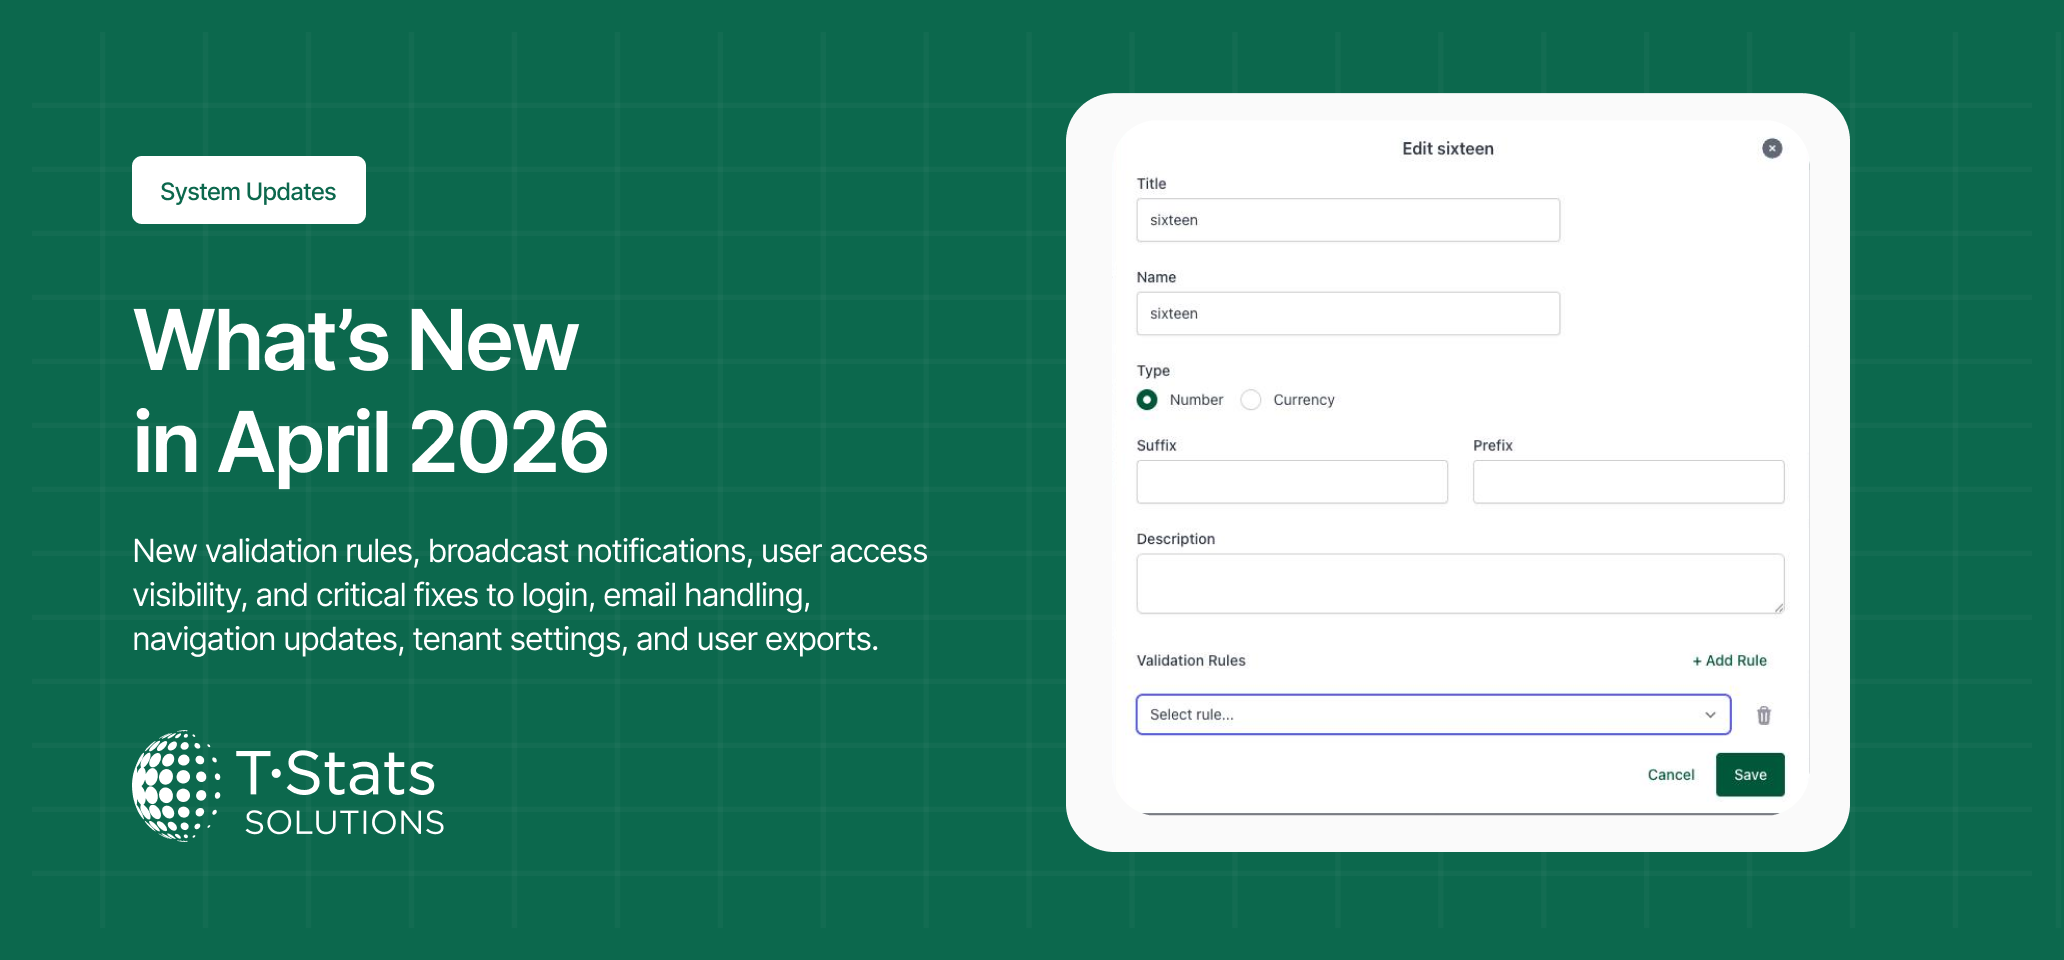
We've made several updates this month to enhance the power and usability of T-Stats Solutions. From field-level data validation to broadcast notifications for all users, here's what's new:

ENHANCEMENTS

Added Field-Level Validation Rules to Data Input

  • What is the change: Added support for comparison and min/max validation rules that can be applied directly to individual data input fields, with errors surfaced in real time.

  • What is the impact: Users now receive immediate validation feedback when entering data, reducing errors and improving data quality across submissions.

Added Broadcast Notifications for All Subscribed Users

  • What is the change: Introduced a broadcast channel that delivers notifications to all users subscribed to a destination system.

  • What is the impact: Users can now be kept informed of important updates without requiring manual outreach from administrators.

Added Users Tab to Tracker Management

  • What is the change: Added a Users tab to the tracker back-end that displays which users have access to each tracker and at what permission level.

  • What is the impact: Administrators can now review and manage tracker access for all users in one place, improving visibility and control.

BUG FIXES

Fixed Login Failure After Password Reset

  • What is the change: Fixed an issue where users experienced a 500 error during login when two-factor authentication conflicted with a recently reset password.

  • What is the impact: Users can now log in successfully after a password reset without encountering authentication errors.

Fixed Email Case Sensitivity in Provider User Addition

  • What is the change: Fixed an issue where adding a user to a provider failed when the email address was entered with different capitalisation to the one stored in the system.

  • What is the impact: Users can now be added to providers regardless of how their email is capitalised, removing the need for manual copy-paste workarounds.

Fixed Menu Not Updating After Configuration Changes

  • What is the change: Fixed an issue where the navigation menu cache was not refreshing correctly, causing outdated menu items to appear.

  • What is the impact: Users now see an up-to-date navigation menu that reflects the latest platform configuration.

Fixed Admin Panel Not Saving Tenant Domain Changes

  • What is the change: Fixed an issue where updates to the tenant domain in the Administration Panel were not being saved.

  • What is the impact: Administrators can now update the tenant domain successfully through the Administration Panel.

Fixed User Role Missing from System Export

  • What is the change: Fixed an issue where the Role column in the system users Excel export was blank for all users.

  • What is the impact: User exports now correctly include role information, making them more useful for user management and access auditing.

Thanks for using T-Stats! We're committed to making the platform better for you and your businesses every month. Your feedback helps shape these improvements — keep it coming!

Write a comment...

March 6th, 2026

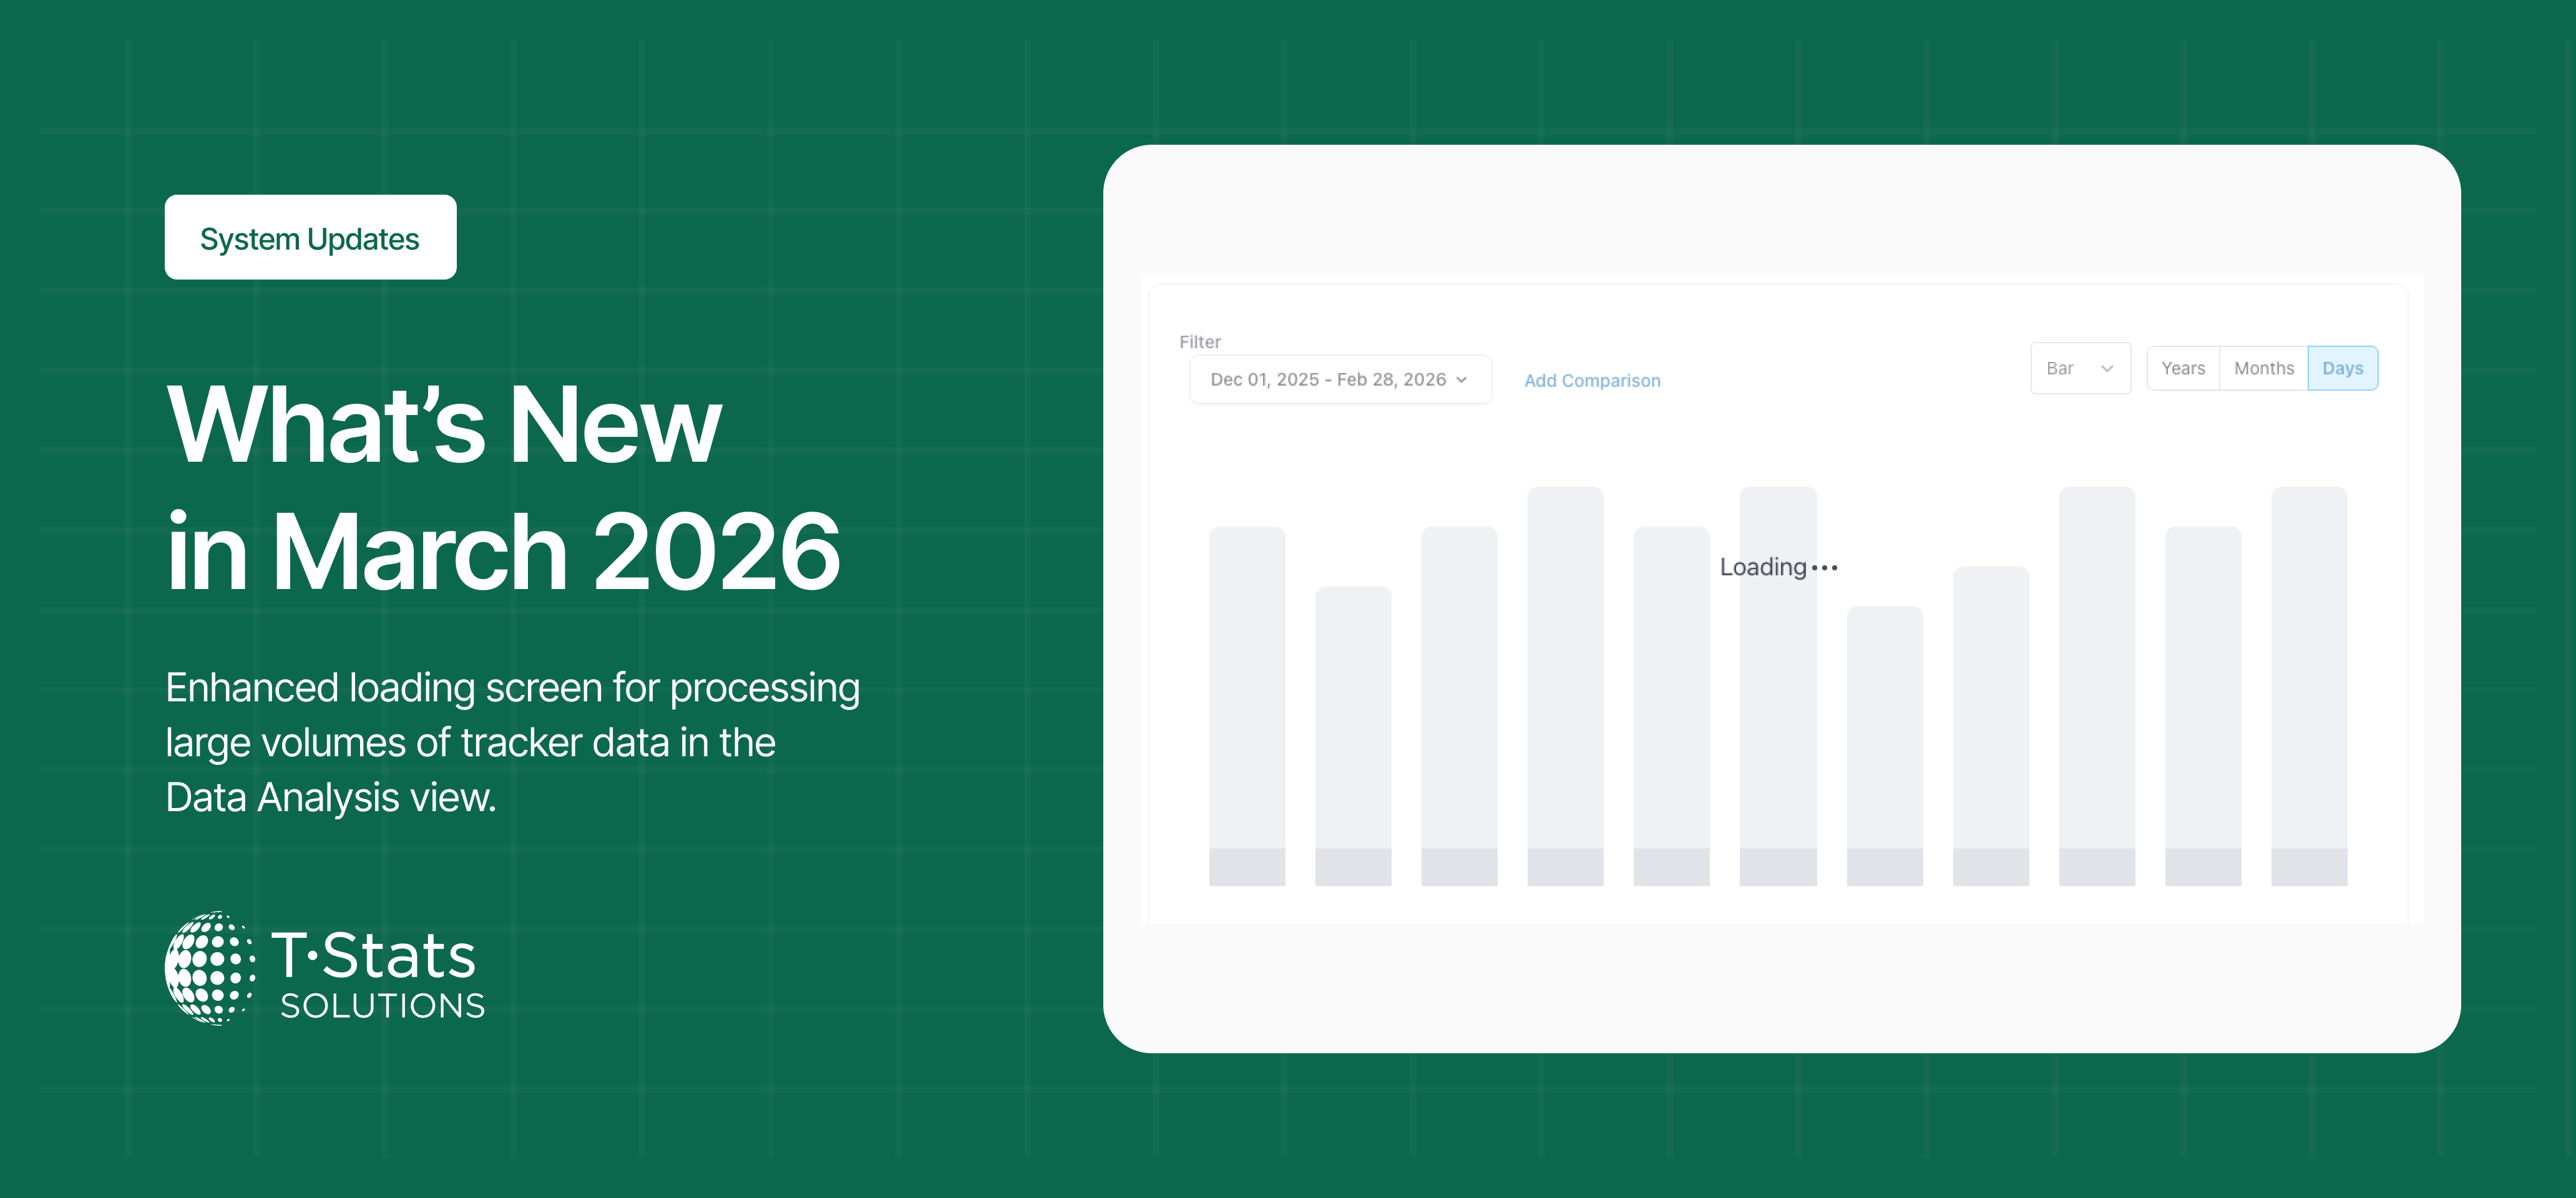
We’ve made several updates this month to enhance the power and usability of T-Stats Solutions. From enhanced data loading to improved data import, here’s what’s new:

Enhancement

  • Enhanced Loading Screen for Data Analysis: Improved the loading state when processing large volumes of tracker data in the Data Analysis view. A clearer and more visible loading indicator now appears on screen, reassuring users that their request is being processed.

Bug Fixes

  • Gateway Timeout on Polygon: Fixed an issue where filtering the Self-Catering KeyData tracker by the polygon resulted in a gateway timeout. Polygon now loads correctly, ensuring consistent performance across all polygon filters.

  • Tracker Metrics Not Updating Charts: Fixed an issue where selecting different tracker metrics did not refresh the legend or graph. Charts now update immediately after metric selection, ensuring accurate and responsive analytics.

  • Chart Type Toggle Not Switching View: Fixed an issue where the chart type toggle did not switch between bar and line views. Users can now seamlessly toggle between chart types for better data visualization.

👉 Thanks for using T-Stats! We’re committed to making the platform better for you and your businesses every month. Your feedback helps shape these improvements — keep it coming!

Write a comment...

December 9th, 2025

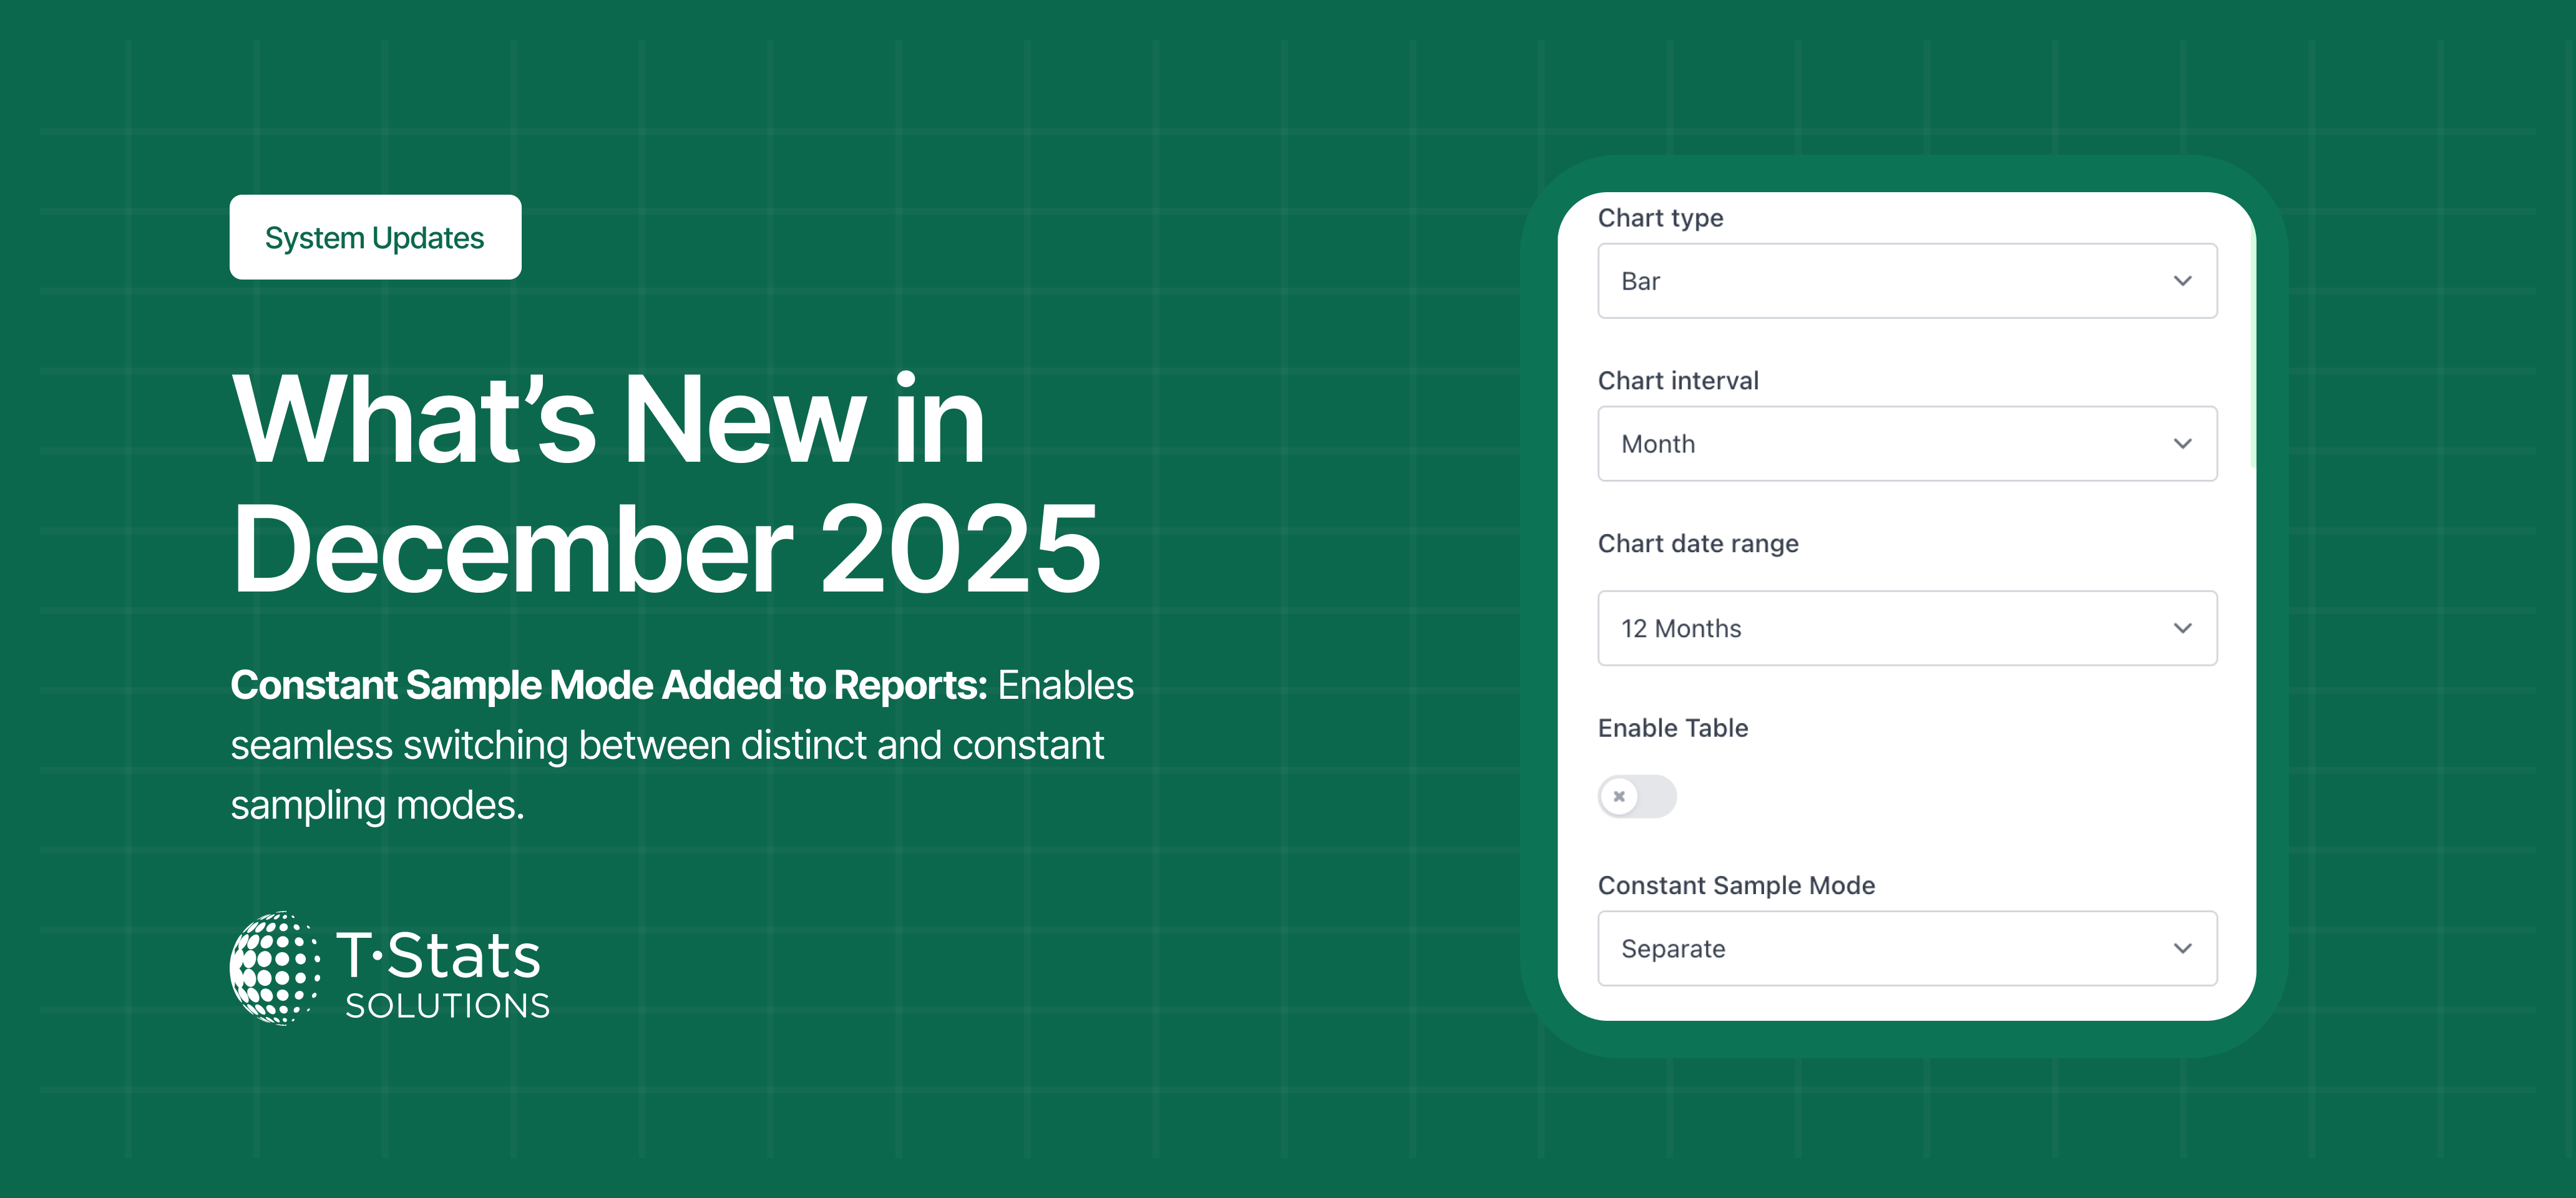
We’ve made several updates this month to enhance the power and usability of T-Stats Solutions. From improvements in help documentation to improved report experiences. Here’s what’s new:

Enhancement

  • Constant Sample Mode Added to Reports: Implemented a new constant sample mode in the report function, allowing users to switch between distinct sampling and constant sampling.

Bug Fixes

  • Reports – improved user experience of integrated Reports functionality

  • Unauthorized Tracker Groups in Cross-Tracker Analysis: Fixed an issue where tracker groups that users did not have access to were appearing in the Cross-Tracker Analysis modal.

  • Attendance Metric Missing in Events Tracker Analysis: Fixed an issue where the attendance tracker metric was not visible in the Events Tracker data analysis view.

  • Incorrect Default Date Range in Data Analysis: Fixed an issue where the default date range in Data Analysis showed only the last 11 months instead of 12.

  • Help Pages – Increased available documents in Help section.

👉 Thanks for using T-Stats! We’re committed to making the platform better for you and your businesses every month. Your feedback helps shape these improvements — keep it coming!

Write a comment...

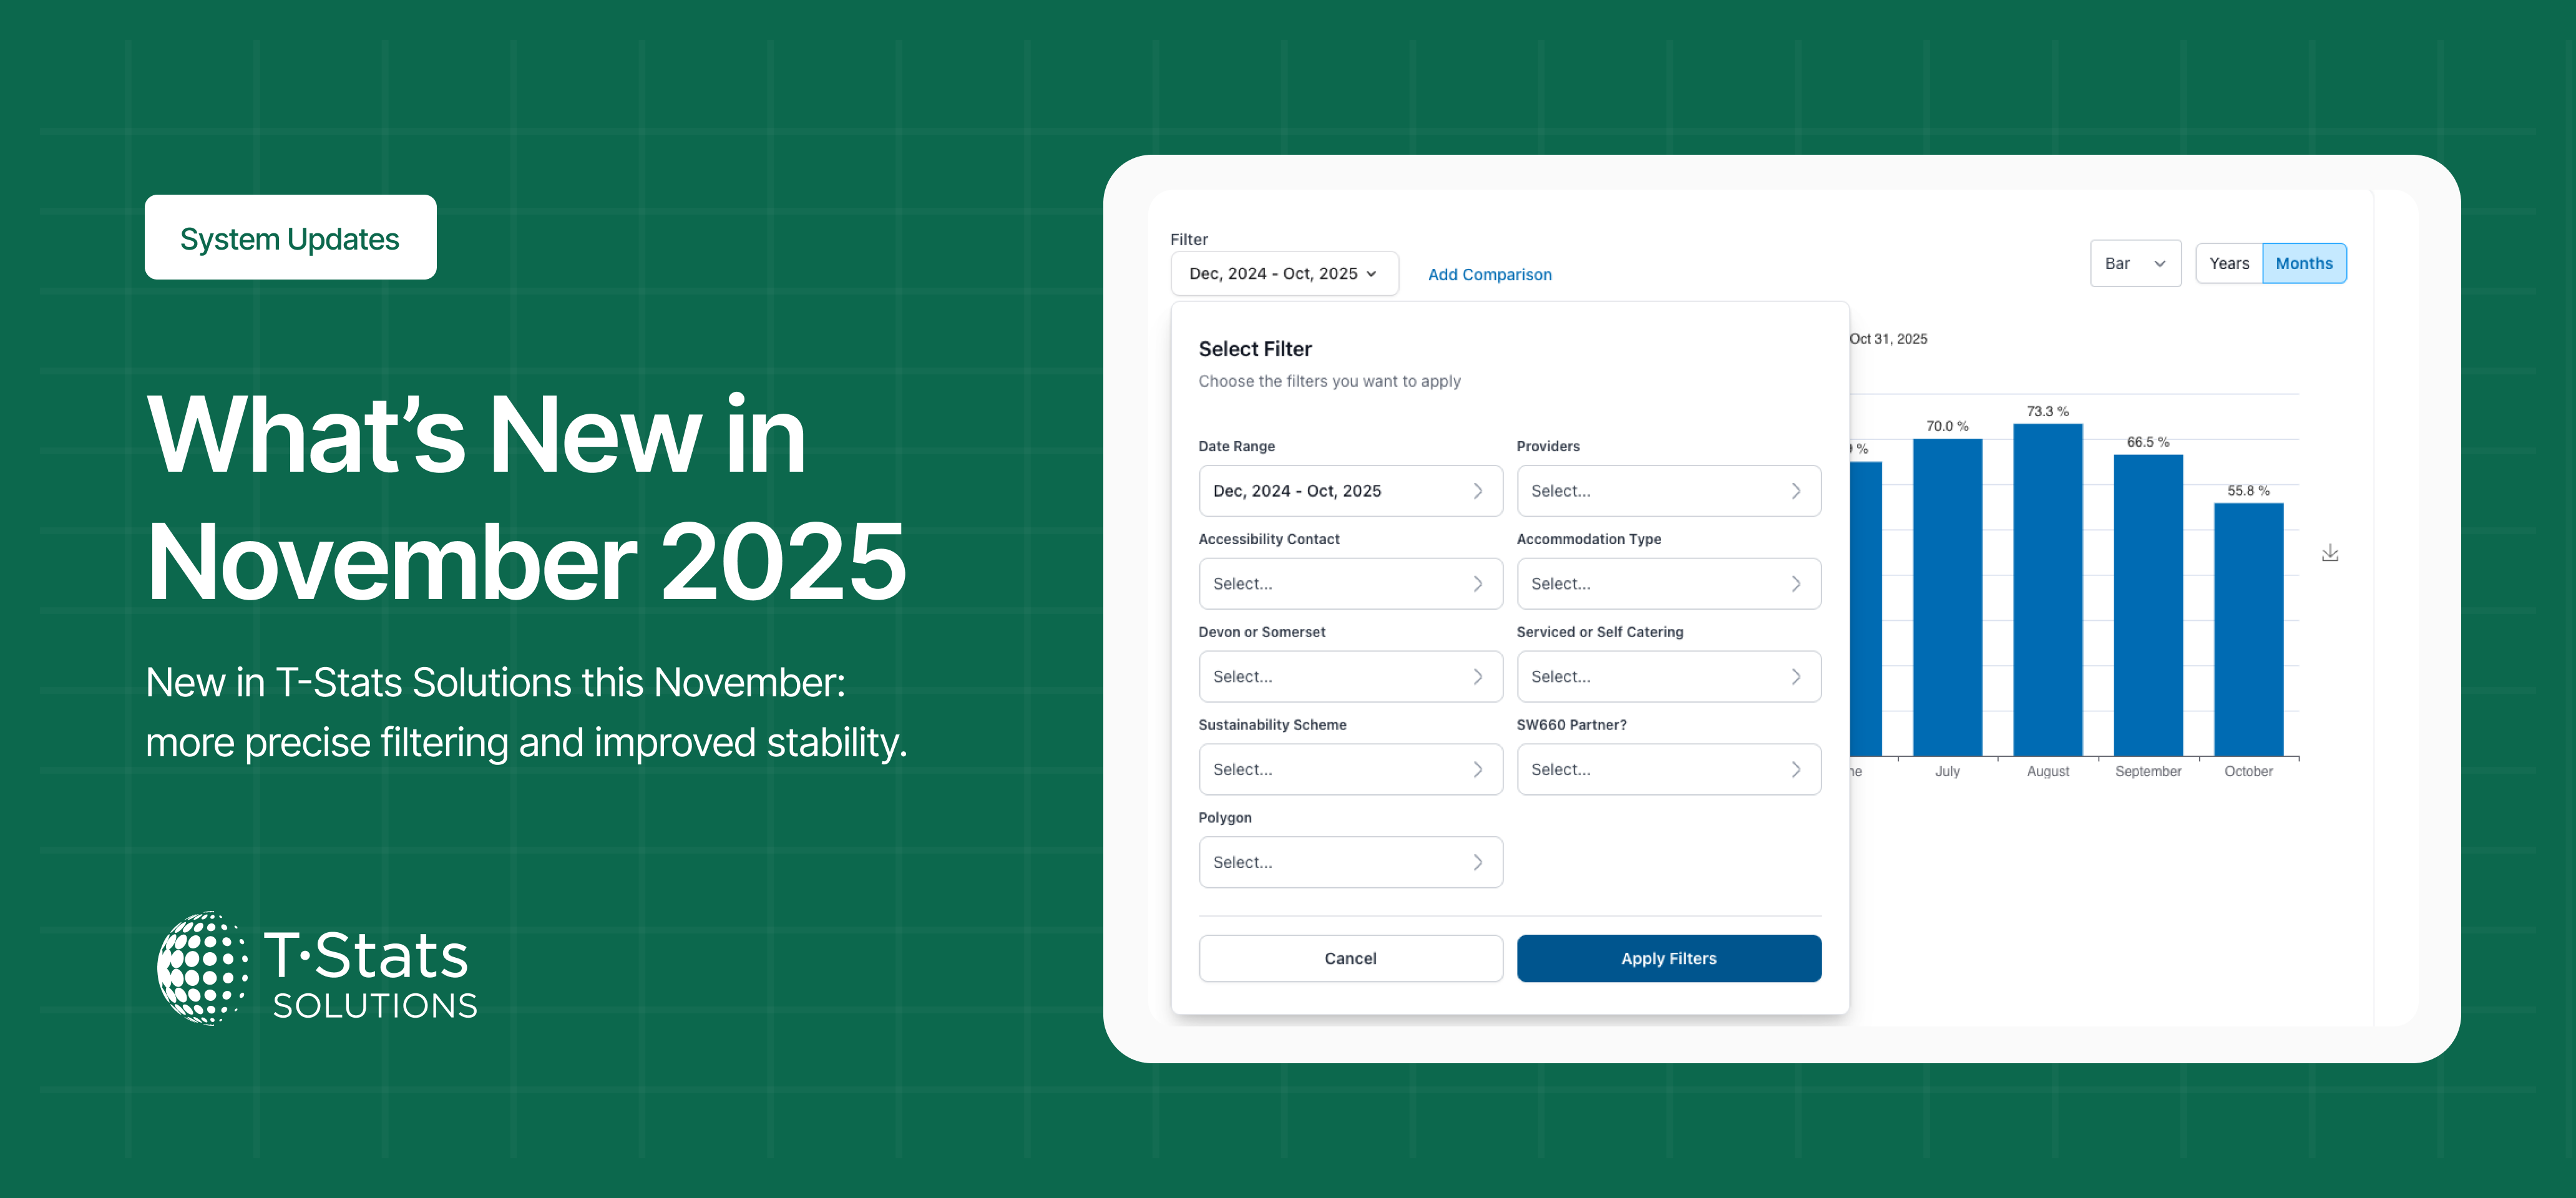
November 5th, 2025

We’ve made several updates this month to enhance the power and usability of T-Stats Solutions. From more precise filtering to improved stability, here’s what’s new:

Bug Fixes

  • Dashboard 500 Error – Fixed an issue causing the dashboard to throw a 500 error. The dashboard now loads reliably without errors, ensuring stable access.

  • Disappearing Events: Fixed an issue where newly created events in the system were disappearing after creation. Events now save and display correctly, ensuring accurate event tracking and management

  • App Window Closes After Account Switch: Fixed an issue where the T-Stats app window would close unexpectedly after a user switched accounts. Users can now switch between accounts smoothly without the app closing.

  • Incorrect Event Count in Slide-Out Sheet: Fixed an issue where the number of events metric displayed an incorrect count in the event tracker slide-out sheet. The metric now accurately reflects the total number of events for specific dates.

  • Done Button Accessibility in Date Filter: Fixed an issue in the Attractions Tracker where users could not access the ‘Done’ button after scrolling within the date filter. Users can now scroll and select the ‘Done’ button. Allowing filters to be applied.

  • Broken App Download Links in Welcome Email: Fixed an issue where the links to download the apps in the welcome email for new users were not working. New users can now access the correct app download links directly from their welcome email.

  • Username Case Sensitivity in Login Experience: Fixed an issue where case sensitivity in usernames prevented users from logging into the system. Usernames are now treated as case-insensitive, allowing users to log in regardless of the letter case of their username.

  • Event Analytics Graph Not Updating: Fixed an issue in the event analytics tracker where the graph did not update after events were deleted. Graphs now refresh correctly to reflect the latest event data.

  • No Data Displayed for Upcoming Events (Polygon Filter): Fixed an issue in the Events Tracker where no data appeared for upcoming events when using the polygon filter. Upcoming events now display correctly within the selected polygon area.

  • Calendar Events Not Visible in Analysis View: Fixed an issue where events created on the calendar were not appearing in the analysis view on the platform. Events now display correctly across both calendar and analysis views, ensuring consistent and complete data visibility.

  • Popup Cut-Off in Period Comparison: We fixed an issue where the popup filter box was cut off when adding a third comparison in the data analysis view. The popup now fully displays all filter comparison options on screen.

  • Attraction Dashboard Title Data Not Rendering: Fixed an issue where the Attractions dashboard tile failed to render data from the tracker.

  • Edit Tracker Access Search Function: Fixed an issue in the system where the search function within the Edit Tracker Access feature was not working. Users can now search and locate trackers efficiently.

  • Tracker Data Export Function: Fixed an issue where the “Export Data from Tracker” function was not sending emails with download links.

👉 Thanks for using T-Stats! We’re committed to making the platform better for you and your businesses every month. Your feedback helps shape these improvements — keep it coming!

Write a comment...

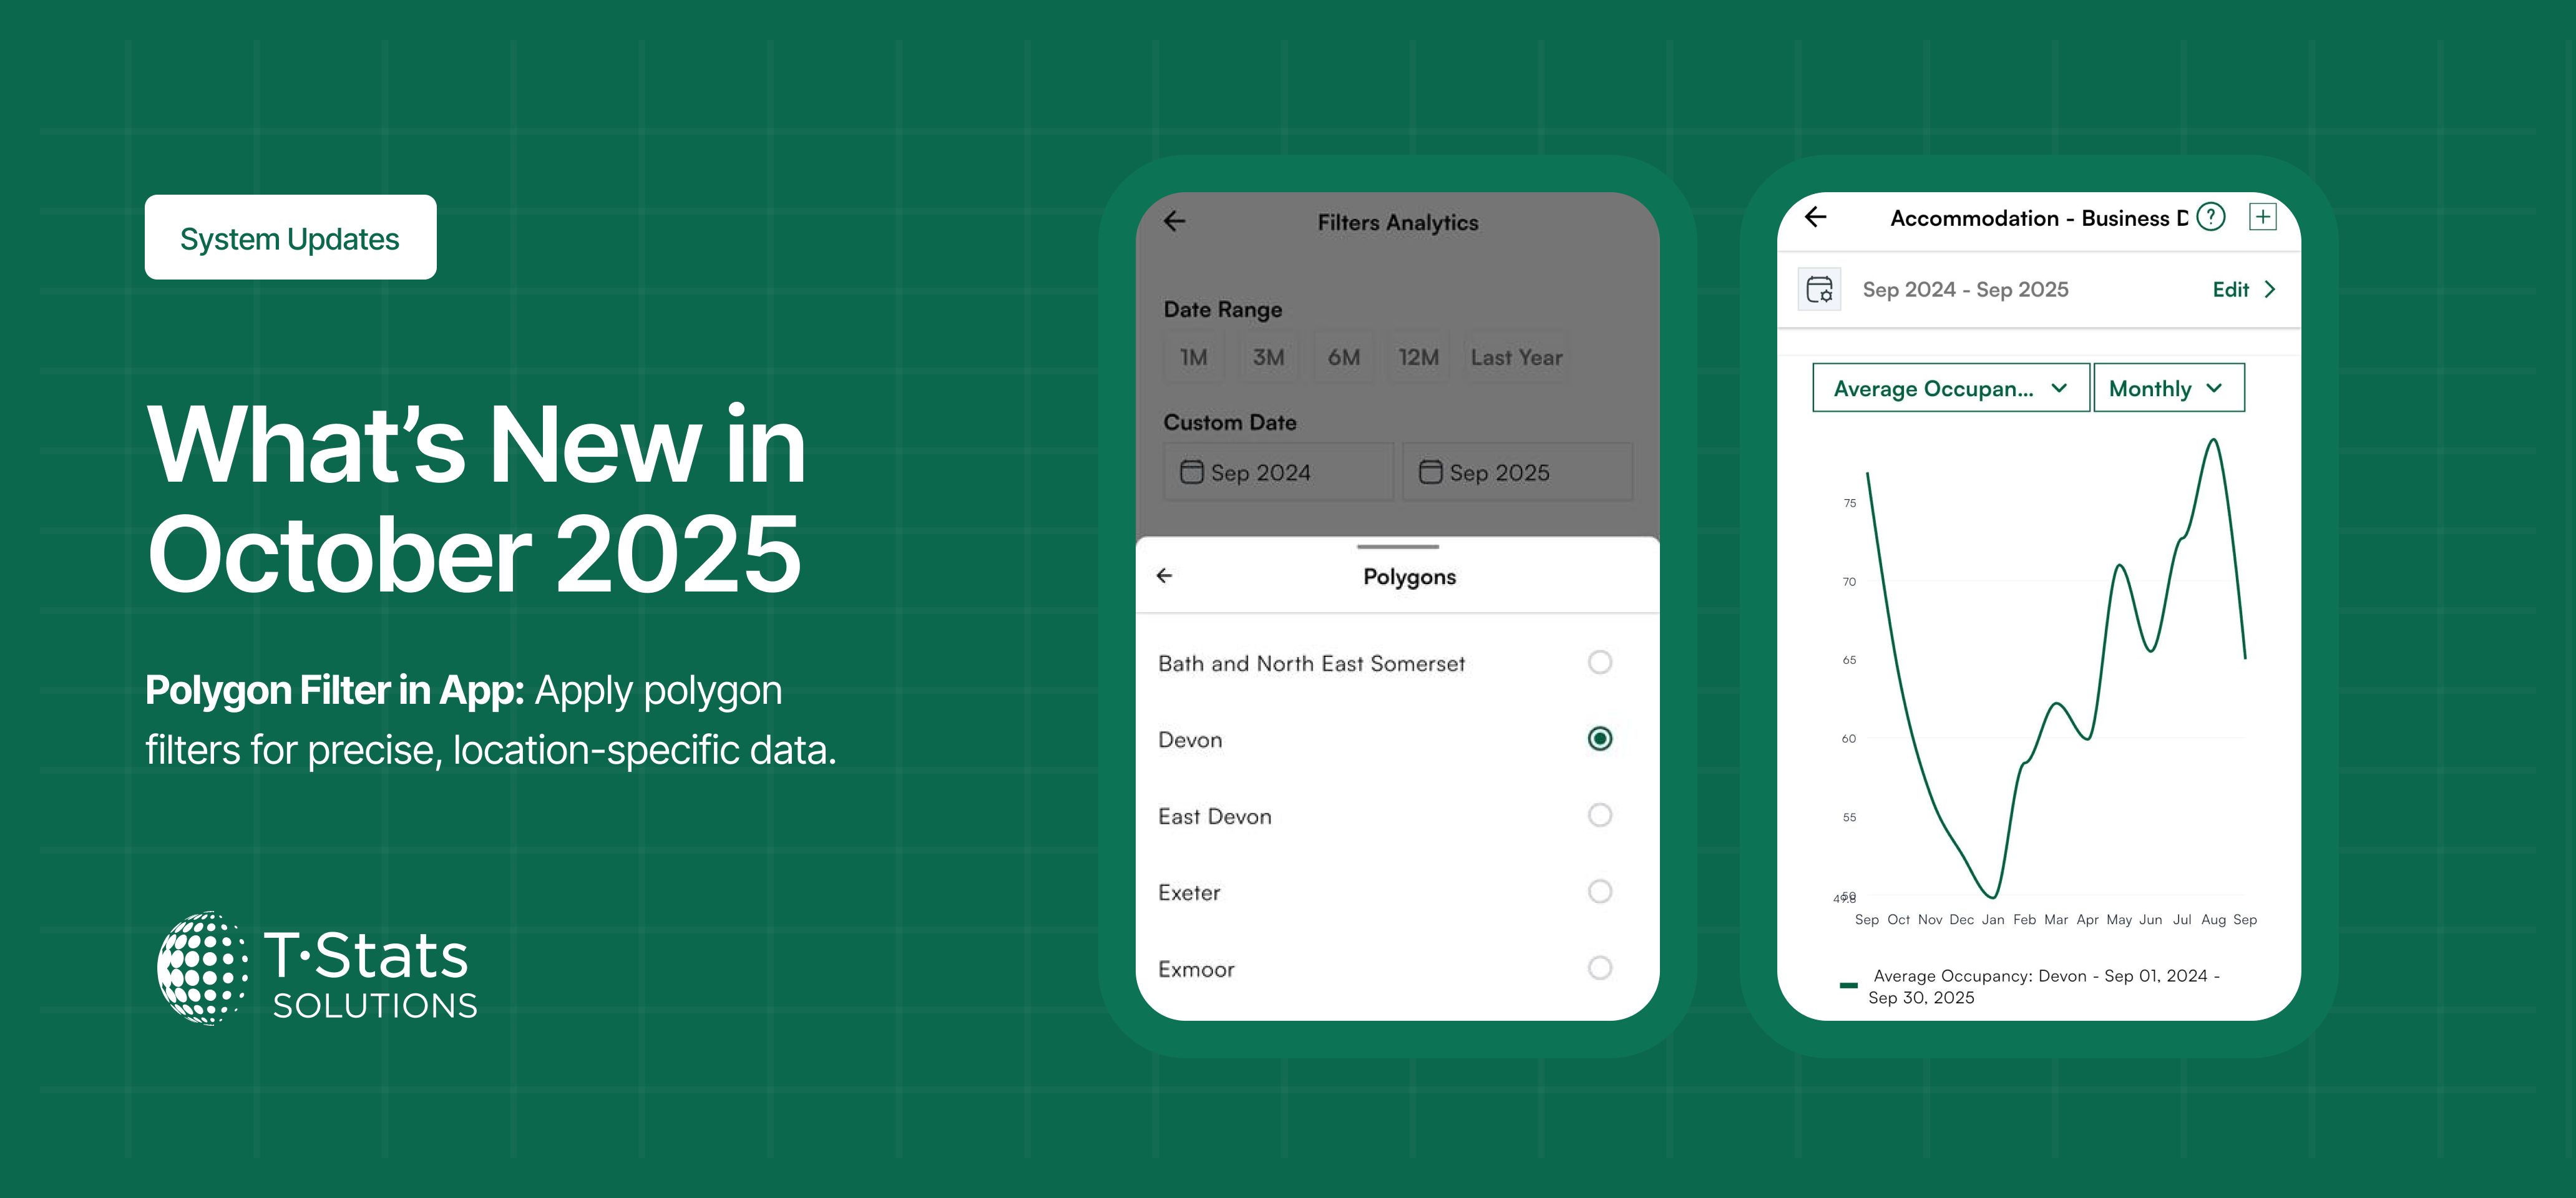
October 9th, 2025

We’ve made several updates this month to enhance the power and usability of T-Stats Solutions. From more precise filtering to improved stability, here’s what’s new:

Polygon Filter in App
Added support for polygon filtering directly within the app. Users can now apply polygon filters for more precise and location-specific data filtering.

Enhancement

  • Updated Weather Widget Labels: Updated the weather widget label to reflect the 5-day forecast and set the default toggle to show the 5-day view.

Bug Fixes

  • National Trackers in Cross Tracker – national trackers are now available in cross-tracker view.

  • Dashboard Widget Colors – graphs now display correctly (green when no prior-year data exists).

  • Settings Menu Visibility – selected admin groups can now see the Settings menu as expected.

  • Saved Events – saved events now appear reliably in the slide-out bar for easy editing.

  • Weather Widget Editing – fixed errors when editing weather widget cards on the dashboard.

  • Calendar Event Creation – resolved errors when creating calendar events with the tracker disabled.

  • Provider Name Field – improved text entry so typing and backspace behave correctly.

  • My Business Visibility – providers can now see the businesses they are associated with in the app.

  • Calculation – Fix calculation when entering data

  • Push Notifications – fixed issues with push notifications so you’ll receive timely alerts again.

👉 Thanks for using T-Stats! We’re committed to making the platform better for you and your businesses every month. Your feedback helps shape these improvements.

Write a comment...